Solar Pump Controller
Introduction
Agriculture in India has a significant history. Today, India ranks second worldwide in farm output. Agriculture and allied sectors like forestry and fishery accounted for 16.6% of the GDP in 2009. About 50% of the people in India get employment from the agriculture. So, we should have very consciousness to develop agriculture. Thus solar water pumping becomes a socially and environmentally attractive technology to supply water. Especially, it is needed for water supply in remote locations which are beyond the reach of power line. Solar energy in particular, has such an established pattern that with an appropriate harnessing technology, it is possible to get considerable part of the world’s energy needs from it. Solar energy is indeed the energy that is derived directly from the sunshine. The sun is the centre of the solar system with which our life and welfare and that of livestock, agricultural and botanical needs of all depends on for survival. Solar energy is very pure and inexhaustible. At present the most successful requirements of solar energy seems to be supply of solar water pump, space heating and cooling as well as generating of electricity etc., of these many uses of solar energy, pumping process is one which has been exploited most.
It is now being accepted as a practical way of providing domestic water pumping system in Japan, Israel, U.S., India and some countries in Latin America. To develop agriculture, we should take care of plants. About 90% of the plant body consists of water. Due to unavailability of energy resources, we are unable to supply water to the crops. But, we can supply water at all time by solar energy. The amount of solar is 60×1015 Wh/day. If we use 5% of available energy it is 60 times the world energy requirement. Water pumping has a long history so many methods have been used to pump water. But, solar pumping is reliable. The use of photovoltaic cell is appropriate because of often relationship between water requirement and solar energy available. During hot season water requirement increases and also solar energy will be available at higher level. Hence, keeping the above in view this research topic has been undertaken with following objectives :
To design and development of solar water pumping system
To evaluate the performance of developed
Materials and Methods
A study was undertaken on design, performance evaluation of solar water pumping system. This chapter deals with the materials used and methods followed in conducting research work of performance evaluation of solar water pumping system.
The main emphasis of the study was to evaluate solar water pump by measuring solar intensity, output voltage (V), current (A), Times (S) and computation discharge rate (lit/h). The performance of solar photovoltaic powered water pumping system was evaluated. The solar photovoltaic of total capacity 8185.6 W (32 panels of 255.8 W each) has been purchased and installed at the center and were used to generate the power to run motor (DC) pump. DC Ammeter, multimeter, thermometer and solar intensity recorder were used to measure DC current, DC voltage, ambient temperature (°C) and solar intensity (W/m²) respectively.
PV controller
The controller has two primary functions. First, it monitors the characteristics of the electricity being produced by the PV panels (volts and amps) and electronically modifies these values to enable the pump to run longer and more efficiently. Secondly, the controller is an electronic switch to control when the pump goes on and off. The controller monitors electricity from the PV panels, the water level in the well, and the water level in the tank to ensure efficient and safe pump operation. The photovoltaic controller works as a voltage regular. A photovoltaic (PV) powered solar controller uses solar electricity produced on-site to run the pump. The primary function of a controller is to prevent the battery from being overcharged by the array. Some PV controllers also protect a battery from being overly discharged by the DC load. It balances entire system voltage andoptimises system performance. The most practical benefit of a PV powered controller is the resultant simplicity of the overall system.
Pump cable and ground wire
Power wiring in conduit is installed from the solar array to the controller. Control wiring in conduit is installed from the controller to the float switch in the tank. Electrical wiring is installed from the pump in the well up to the controller. It used to connect the pump to the solar array. It must be sized properly to minimize line losses. Ground all equipment because water pumps attract lightening due to the excellent ground they provide. Locating arrays on high spots are avoided. Consider electric lightning rods on high ground around the pump to attract lightning away from the pump.
Safety disconnects
Mathematical switches to manually shut off electricity in case of an emergency or maintenance. These switches usually installed between the solar panelsand the controllers and between the controller and the pump.
Orientation and direction of the PV array
Orientation of the PV array is one of the most important aspects of the site assessment. The PV array is positioned in such a way that the sunlight is utilized to its maximum that is true south direction. The ideal orientation for panels is south as they will be exposed to the sun for the maximum length of time during daylight hours, although other orientations still produce considerable amounts of power and attract significant tariff income. The local declination which depends on the location and changes with the times should, however, be taken into account.
Determination of tilt angle
The tilt angle was selected in accordance with the latitude of the location. Measurements of current and voltage The current I (A) and Voltage (V) generated by the PV array under both tracked and nontracked condition was recorded every hour of the sunny day from 10:30 am to 04:30 pm using DC ammeter. To measure the output current and voltage of the PV array the DC ammeter was connected directly to the power supply terminals of the PV array.
Power output
The power outputs from the solar photovoltaic panel on a typical sunny day .The product of voltage and current generated from the SPV panel gives the power output in terms of watt. Power (P) = Voltage (V) X Current (I) Where, P = output power of SPV, watts V = voltage, volts I = current, amps
Discharge (Flow rate) of the pump
Volume of water delivered by pump per unit time m³/h or m³/sec. The discharge of the DC pump used in the test was measured by volumetric method by collecting the water in 25 liters container and the subsequent time taken to fill the container was recorded using stopwatch. The same was repeated for five trails and the average of five trails was considered.The same method was carried out under both non-tracked and tracked conditions. Q = amount of water collected (liters)/time taken (sec)
Results and Discussion
The performance of solar pumping array has been evaluated under normal climatic conditions. To understand correct mechanism of change in one parameter causes other to change.
Variations
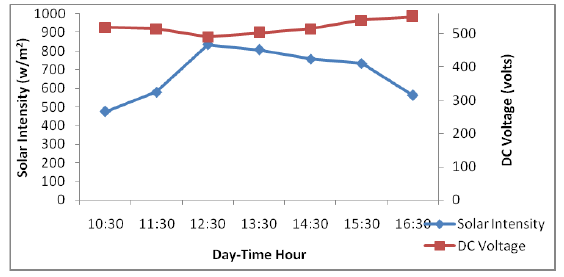
Variation of voltage and current
The variation of voltage and current with respect to solar intensity were presented in figure 1 corresponding voltage and current distribution curve has been plotted. However, corresponding variation in voltage produced was in the range from 490.82 to 550.89 volts and correspondence variation in current generated was in the raise of 12.80 to 15.99 amps.
Variation of DC power output with respect to input solar radiation
The variation of DC output power with respect to solar intensity were presented in the figure 2 range corresponding DC output power v/s solar radiation graph is plotted. The DC output power will be in the range of 7051.40 to 7848.22 watts for corresponding change in solar intensity in the range of 476 to 834 W/m2.
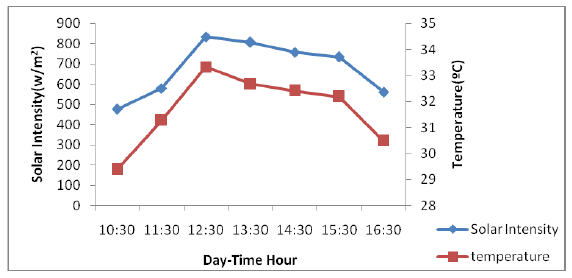
Variation of temperature with respect to input solar radiation
The radiations of Temperature with respect to solar intensity were presented in the figure 3. Corresponding Temperature V/S input solar radiation graph is plotted. The Temperature valves will be in the range of 29.38 to 33.33 0C for corresponding change in Solar Intensity in the range of 476 to 834 W/m2
Variation of DC power output power with respect to temperature
The variations of output power with respect to temperature were presented in figure 4. Corresponding output power v/s temperature graph is plotted. The output power in the range of 7051.40 to 7848.22 watts for corresponding change in temperature range of 29.38 to 33.33 0C.
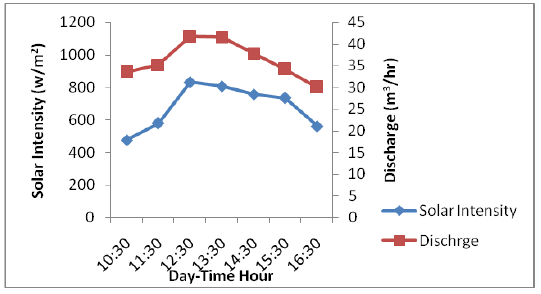
Variation of discharge with respect to solar intensity
The variations of discharge with respect to solar intensity were presented in figure 5 and corresponding discharge v/s solar intensity graph is plotted. Discharge produced in the range 48.12 to 51.50 m3/h for corresponding change in Solar Intensity in the range of 476 to 834 w/m2
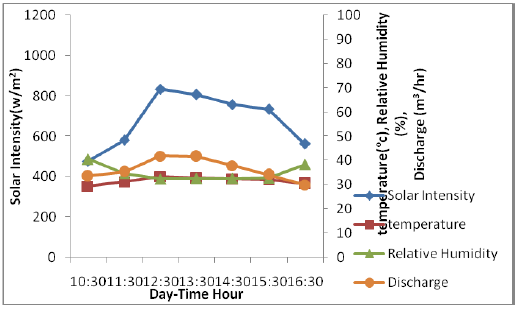
Variation of discharge with respect to relative humidity
The variations of discharge with respect to relative humidity were presented in the figure 6. Corresponding discharge v/s relative humidity graph is plotted. The discharge produced in the range of 48.12 to 51.50 m3/h for corresponding change in Relative Humidity in the range of 32.38 to 40.56 % By above these curves, we can evaluate the performance of photovoltaic module. The total electric power output of a photovoltaic module is equals to its operating voltage multiplied by its operatives current. The output characteristics of any given module were characterized by a performance vies called an I-V curve that shows relationship between current and voltage output. The print labeled Vmp and Imp was the operating point at which the maximum output was produced by the module at operating conditions indicated for that curve. The voltage at the maximum power plant could be determined by extending a vertical parallel from the curve downward to read a value on the horizontal voltage scale. The relation between current and voltage in the polynomial form below, Y = 0.0815 – 6.0137 x + 110.4 The correlation coefficient between current and voltage was 0.9452. As it was maximum than 0.90 It shows perfect correlation between them.
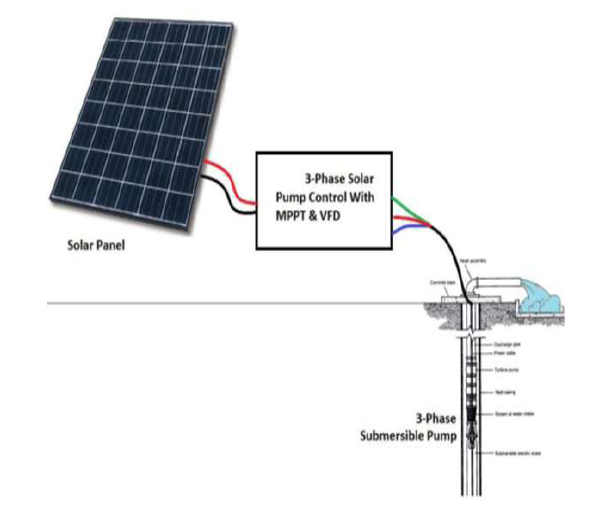
Components of water pumping system
Variation of temperature with respect to input solar radiation
Variation of DC power output power with respect to temparature
Variation of discharge with respect to solar intensity
Variation of discharge with respect to relative humidity
The solar PV water pumping unit was installed and tasted in test site. The solar PV pumping system consists of 32 modules of 255.5 watt each and 7.5 hp Dc centrifugal mono block solar pump. During morning condition the minimum and maximum solar intensity were observed in the range of 476 to 580 W/m2. However, corresponding variation in the voltage produced were in the range from 519.19 to 515.14 volts. Whereas during noon condition minimum and maximum solar intensity were observed in the range of 562 to 834 W/m2. However, corresponding variation in the voltage produced in the range 490.82 to 550.89 volts. During morning condition under normal (solar intensity low) condition, power increased from 7580.18 to 7783.76 watts. The power produced from the PV array was dependent on the incident solar radiation. The pump delivered maximum discharge in morning condition 35.23 m3/h for an average solar intensity of 580 W/m² performance of photovoltaic module by drawing I-V curve analysis during morning condition. The pumping efficiency varied from 25.27 to 29.28 %. During noon conditions (when solar intensity is high), the power varies from 7848.22 to 7051.40 watts.
The pump delivered maximum discharge in the noon conditions 41.82 m3/h for a solar intensity of 834 w/m². Performance of photovoltaic module was made by drawn I-V curve analysis during noon condition. The pumping efficiency varied from 66.07 to 56.60 %. During morning condition (when solar intensity is low), pv system produced voltage in the range of 519.19 to 515.14 volts, when solar radiation in the range of 476 to 580 w/m²a t 10:30 to 11:30 am on clear days. Whereas, during morning conditions pv system produced current in the range of 14.60 to 15.11 amps. During noon conditions pv array produced maximum power of 7848.32 watts at 12:30 pm while, Vmp and Imp were observed 490.82 volts and 15.99 amps respectively at solar radiation 834 w/m².It was observed during noon condition pump delivered maximum discharge of 41.82m³/h when solar intensity of 834 w/m² at 12:30 pm and produced minimum discharge of 33.56m³/h in morning condition. It was observed that in morning conditions pumping efficiency varied from 57.56 to 62.46% while, in the noon conditions pumping efficiency from 66.07 to 56.
Levicon transformer-less solar pump control with MPPT and VFD -1HP to 5HP
LEVICON has announced the release of its new design of solar pump control with inbuilt MPPT and VFD which is targeted towards low power use. The design is best suited for applications up to 5HP. The main attractions of this new design are it is low cost & extremely simple to assemble because DSP control stage and power stage and heat sink are on a single PCB.The DSP control module does most of the job which makes the rest of the PCB very simple and leaves few components to be assembled on the main PCB. The complete control stage, SMPS, IGBT module along with heat sink are all in a single PCB which makes it easy to manufacture.
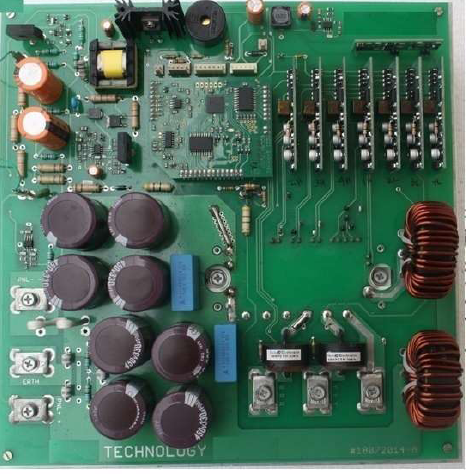
The photo above shows the complete assembled low power solar pump control for 5HP
Features
- This solar inverter with MPPT VF drive will give maximum torque even at minimum sunlight.
- There is no need of any battery, directly connect the panel to the inverter and the output of the inverter can be connected to a three phase motor.
- The DSP will track at which point the maximum power can be extracted from the panel by varying the PWM and modulation frequency so the motor will run always extracting the maximum power from the panel and at a constant torque for the wide range of intensity of sunlight -morning till evening.
- This will give 35% extra energy which results in pumping 35% more water compared with the conventional three phase inverter +MPPT & three phase pump or DC motor based pump.
Specifications
Panel voltage range: 90V to 850
Wattage: 0 to 5HP
AC output voltage: 0 to 480V phase to phase
Output frequency: 0 to 65Hz
1. DSP based intelligent Maximum Power Point Tracking (MPPT) will give 35% more energy from the panel.
2. Because of the variable frequency drive (VF drive) the starting current of the motor will come down drastically. So the motor will start even at minimum intensity sunlight -say morning 7 o’clock.
3. VF drive will give constant torque for wide range of intensity of sunlight -morning till evening. So water will be continuously pumped from morning till evening.
4. PWM frequency -4KHz & 20KHz (settable)
5. Wide range of operating voltage
6. Pure sine wave three phase current to motor
7. Wireless zigbee communication
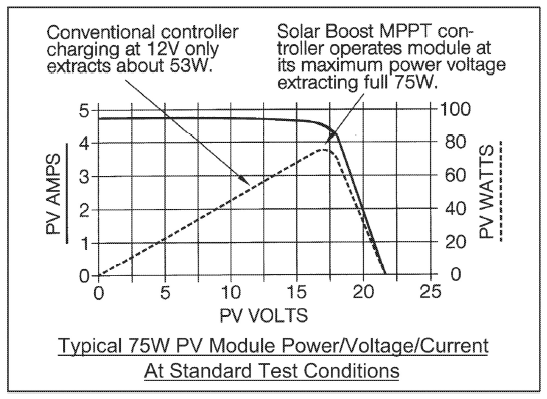
MPPT action -Maximum Power Point Tracking
If a DC motor is used along with the pump there is no MPPT action. If the motor is designed to work at maximum power point during peak sunlight (noon) then at less intensity sunlight (mornings and evenings) the motor will not be at its maximum power point so the full energy is wasted. On the other hand if the motor is designed for maximum power point during less intensity sunlight, it will not be at its maximum power point during noon which again leads to waste of energy. Even though this method is used in many places it is in-efficient. This system works at its best during any time of the day at any kind of sunlight so effectively we will get 35% extra energy which is being wasted at present using other inefficient methods.
For example –
If the system is drawing 10A from the panel and if the panel voltage drops to 600V, then
we get 6000W.
If we are drawing 12A, the panel voltage drops to 498V, then we get 5980W.
If we are drawing 9A, the panel voltage will be 665V, then we get 5990W.
So the maximum wattage was obtained when we are drawing 10A.At various conditions of temperature, sunlight intensity etc the maximum power point will vary so we may also get maximum power at 9A or 11A or some other.
Our unit will convert the panel voltage directly to three phase and vary the PWM for varying the panel current and the DSP will calculate at what current the maximum power can be extracted from the panel, this point will be tracked constantly. As and when this point varies the unit will follow and re-track this point at all sunlight intensities and weather conditions. This way, we have now obtained the maximum power from the panel.
Buck and boost feature
The design is suitable for wide range of panel voltage and the output will be 415V three phase because there is buck and boost feature. With panel input range from 90V to 850V, it can give output of 415V three phase. If the panel is 90V, it will be boosted to 415V, if the panel is 850V the unit will buck to 415V. The maximum IGBT current is limited to half of the rated value for better reliability. Because of this, when you use low panel voltage the output VA will be less, when you use higher panel voltage the output VA will be more.
Typical installation examples –
0.5HP motor -panel VMP above 90V
1HP motor -panel VMP above 150V
2HP motor -panel VMP above 300V
3HP motor -panel VMP above 450V
4HP motor -panel VMP above 600V
5HP motor -panel VMP above 750V
Variable frequency drive eliminates the high starting current of the induction
motor
The induction motor has very high starting current which is around eight times of the running current of the motor. If the motor is started with load, the starting current is much higher than this. Without smooth start high wattage panels are required for starting the motors. Because of the smooth start using variable frequency, the motor will start as early as even 6am without taking any starting current. It is practically observed that the starting current will be lesser than the running current from the panel.
Maintaining maximum efficiency of the induction motor by varying VF ratio
The induction motor has maximum efficiency at certain VF ratio. By simply increasing the voltage or the frequency we are reducing the efficiency. If we increase the voltage the slip will reduce so the efficiency and torque will reduce. If we increase the frequency the slip will increase so the efficiency and torque will again reduce. The induction motor has maximum efficiency at a certain slip.
The graph below explains –
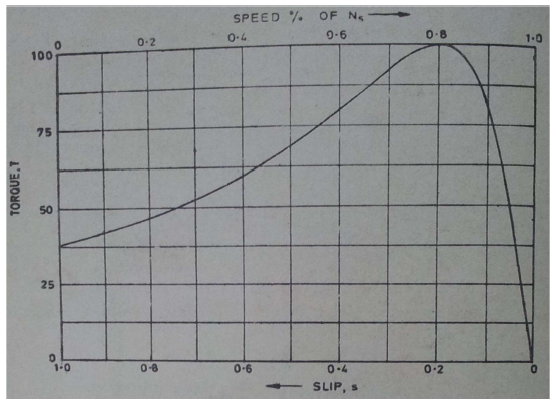
The system runs at maximum efficiency at all the time by constantly maintaining the motor in the right slip which leads to this maximum efficiency.